
This writing is for those who want to take their trading skill to the next level. In financial and trading world, mastering the art of technical analysis is essential for success. Head and shoulder are one of the most powerful and reliable technical analysis patterns that every trader should be expert of. Due to its distinctive shape, the pattern can be identified with the help of one head and two shoulders just like human body. This is a key indicator that gives the signal of trend reversal. If you become familiar with the identification and usage of head and shoulder pattern then you will have a clear edge in the trading world.
In this article we are going to go into deep of head and shoulder analysis and will give you the step-by-step guide to spot the pattern on price chart, and effectively implement it into your trading strategy. Irrespective of the fact that you are an expert trader or the beginner one, learning the head and shoulder pattern will enhance your technical analysis skill and boost your trading profitability.
Understanding the Basics of Chart Patterns
Price chart patterns are the visual representation of price movements that traders use to identify the market trends and predict the future price movements. Such price patterns can provide valuable insights to traders to help them identify potential trading opportunities. Before going deep into technical analysis head and should pattern let’s build some foundation for chart pattern.
Chart pattern can be divided into two main categories, one is continuation patterns and second is price reversal patterns. The continuation patterns depict that price will continue to move in the same direction it is moving. On the other hand, price reversal patterns predict that the trend is going to end and the price reversal is going to happen soon. Head and should pattern be one of the reversal patterns that also give signal that the price is going to reverse. It is considered one of the most powerful and reliable price patterns to predict trend reversal.
What is technical analysis Head and Shoulders Pattern?
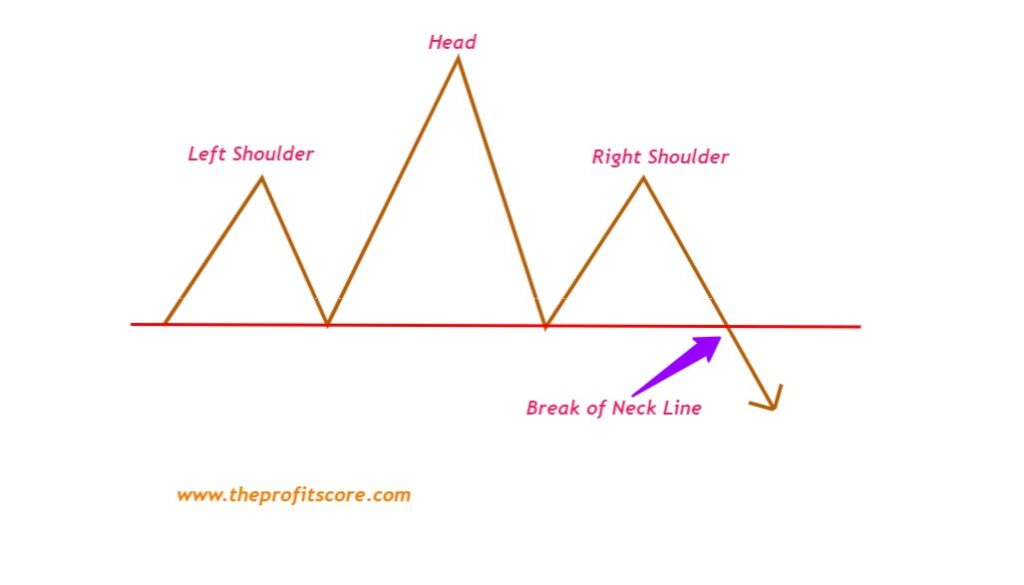
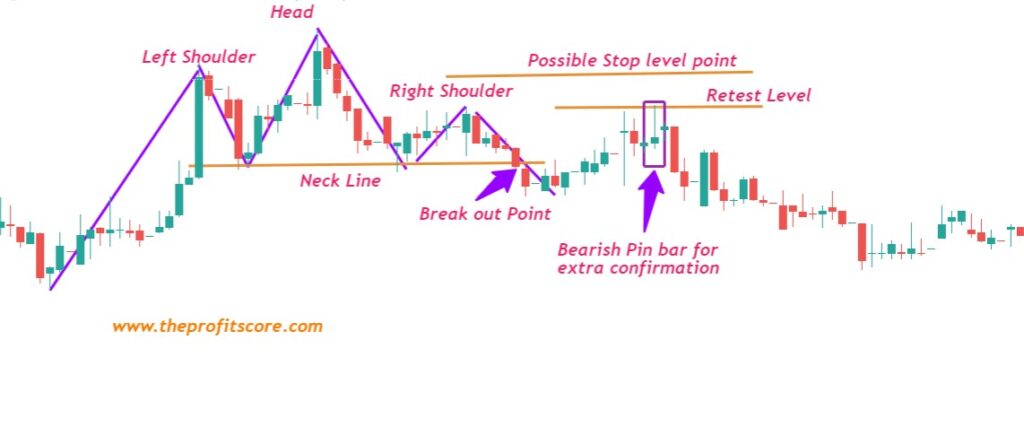
The head and shoulders patterns are price chart patterns that falls under the category of technical analysis and price action trading. It usually forms at the end of uptrend and depict that the price is going to reverse. It can be identified with the help of three peaks, where the middle peak which is called head is clearly higher than the two other peaks resembling the shoulders. The pattern is considered complete when the price move below the neckline which also act as a support level as indication in the below picture.
The technical analysis head and shoulder patterns are a visual representation that the sentiments in the market have been changed from bullish to bearish. It signifies that the bulls are losing control and the bears are gaining momentum thus pushing the price towards downside. Traders who can identify this pattern at the early stage has the opportunity to enter into short trade at the very early stage and thus riding a trend for a longer time from the anticipated downward price movement.
Anatomy of the technical analysis Head and Shoulders Pattern
Without understanding the anatomy of technical analysis head and shoulders pattern, it is not possible to effectively identify and the implement the pattern in the trading strategy. This pattern consists of three main elements, starting with the left shoulder, then head and in the end the right shoulder. Let’s have closer look on these elements.
When the prices reach a higher point in an uptrend and retraces, it forms a temporary peak. This peak is higher than the previous peak and makes the left shoulder. After some correction, the price again moves in the upward direction and passes the previous peak making an even higher peak which is called the head of the pattern. After that price retraces again. The third time prices start moving upward but at this time, fail to pass the previous peak which is the head. After failing, it reverses and pass the neck line below making the right shoulder thus completing the head and shoulder patterns.
Identifying the Head and Shoulder Pattern on a Price Chart
So far, we have identified the basic anatomy of the head and shoulders patterns. Now its time to identify it on a price chart. This pattern can be identified on the basis of many elements, including three peaks, neck line and volume analysis.
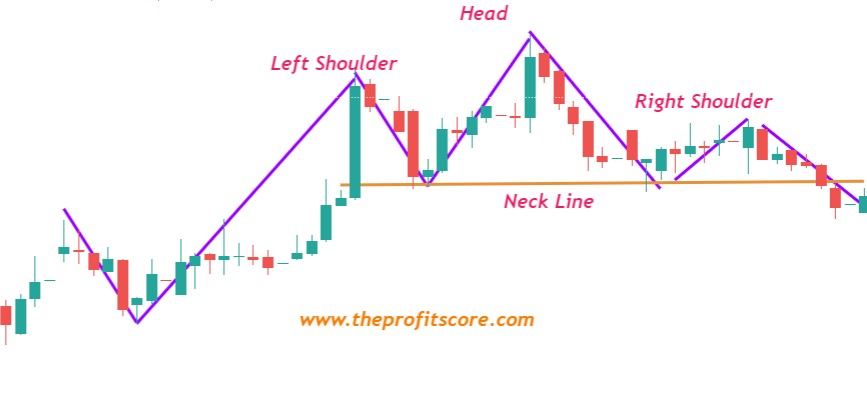
To recognize the head and shoulder pattern, first identify the uptrend in the market. Once you have identified the uptrend then look at three peaks at the end of the trend. These peaks should form the shape of head and shoulder. The right shoulder and left shoulder should be of equal size with some small variations while the head should be clearly higher than these shoulders.
The neck line is the most important component of head and shoulders pattern. It connects the lows of the left and right shoulder and head. The neck line is the support level and when the price moves below, it means it violated the support area. At this point the pattern gets complete and it is considered that the price has reversed.
Another important element that should be considered while identifying the head and shoulder pattern is the volume analysis. While making the first peak or the left shoulder the volume should be higher. While making the second peak the head, the volume should also increase depicting the momentum. But while making the third peak or the right shoulder the volume should decrease. This decreased volume depicts that the momentum has been lost, and the bulls are no more in control.
The Psychology behind the technical analysis Head and Shoulder patterns
The psychology behind the head and shoulder patterns can deliver valuable information regarding market sentiments and help traders to make better decisions. These changing sentiments depicts shift from bullish sentiments to bearish sentiments. It indicates that buyers are losing control and bear are now in charge of the market with gaining momentum.
During the formation of the first shoulder and head, the buyers are in control which is depicted by pushing the price higher in the head level after the left shoulder. But at these points, the bears start getting the control and bring the price as low as the neck level. Then the bulls make their last try to push the price higher, but at this time they have too low momentum to push the price equal to previous high. Now, the seller are in the game and they start moving the price below and dragging it below the neck line that depict the completion of not only the head and shoulder patterns but also the shift in market sentiments.

Trading Strategies for the Head and Shoulder Pattern
As we have covered the basics of technical analysis head and shoulders pattern, now let’s explore some trading strategies to implement this powerful pattern. Below are the few trading strategies to consider.
1. Breakout Strategy
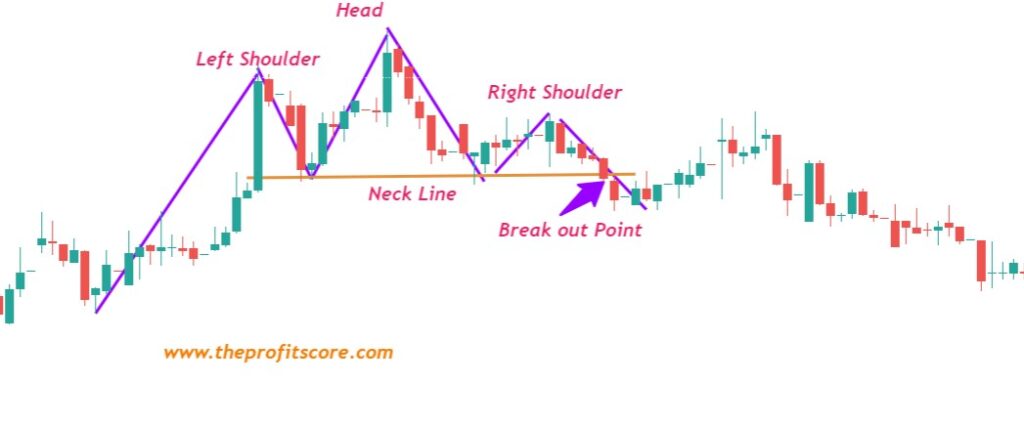
In this strategy, we wait for the price to break the support level which is in this case, the neck line of the pattern. This breaking down of the price below the neck line is considered as the confirmation of break out in the lower direction and traders can take short position at this level. The stop loss order can be place on the upper side of the swing high of right shoulder to manage the risk.
2. Retest Strategy
In this strategy, traders do not go for a short position straight after the price break down the neck line. They wait for the price to retest the neck line or support level which is now acting as the resistance level. They take short position when the price starts moving down after retesting the neck level thus giving them more confirmation of the breakout to enter the short position.
3. Measured Moved Strategy
In this strategy, traders calculate the distance from head to the neck line and projecting the distance of the price from the break out point in the lower side. Through this way, they can set their profit targets to maximum utilize the downward trend to predict the potential downward price movement.
It is worth mentioning here that no trading strategy is the guarantee of 100% profitability. So, it is better to use other technical analysis and price patterns in combination and always apply risk management strategies.
Common Mistakes to Avoid When Trading the technical analysis Head and Shoulder Pattern
Technical analysis Head and shoulders pattern is one of the most powerful tools to predict the trend reversal. Even though, there are some mistakes that trades make while trading with this pattern. You should avoid these mistakes to improve your trading performance and increase profitability. Below are the most common mistakes that should be avoided.
1. Premature Entry
Most often, trades become impatient for taking their trades and this is the most common mistake while trading with head and shoulder pattern. Trades enter the trade before the pattern is fully completed and price breaks the neckline. It is important to wait for the confirmation of the pattern and let the pattern complete first before entering the trade. This will save the trades from false signals and minimize risk.
2. Ignoring Volume
Volume plays a vital role to confirm the eligibility of the head and should pattern. Trades can lead to misleading signals if they ignore the trading volume. Only trade those patterns that comes up with high volume which shows the momentum and changing sentiments in the market.
3. Lack of Risk Management
Giving proper attention to risk management is essential in every trading strategy. Always trade with proper stop loss orders so that you can exit the trade in case it do not go in your favor. Also keep your position size small to keep your emotions and fear out of the market. analyze your risk tolerance level and trading personality and apply proper risk management strategies accordingly.
You can stay disciplined in your trading approach by avoiding these common mistakes. Your chances of success will be higher by trading with head and shoulder pattern if you act as a disciplined trader.

Tools and Resources for Mastering Technical Analysis Head and Shoulder pattern
Right tools and resources are necessary to effectively trade the technical analysis head and shoulder patterns and master the technical analysis. Below are some tools and resources are mentioned that you should consider.
1. Charting Software
Charting software is essential that provides advanced technical analysis tools. With the help of advance price chart, you can easily identify different chart patterns including head and shoulder.
2. Educational Resources
Trades can take help from online free resource like theprofitscore.com, book, tutorials and guidelines that provide expertise regarding technical analysis and especially focus on head and shoulder pattern. Update your skills on regular basis to be success in trading.
3. Community and Forums
Different kinds of online communities are available where expert traders discuss many ideas and strategies. You can get the trading insight, expertise and even ask a question or problem from the experienced trades. Most of the traders in these communities are very welcoming and happy to provide any kind of assistance.
4. Back Testing and Paper Trading
Always back test your trading strategies on historical data and see their effectiveness. You can also back test the technical analysis head and shoulder pattern on different market conditions and check its performance. Through this way, you can find any weaknesses and can update your trading strategy. Use your trading strategies on demo trading account before trading with the real money. Most of the broker and online website provide the services of demo account. If you trade well on demo account, then it will boost your confidence and make you ready to enter the real market.
By utilizing all these tools and resources, and practicing your trading strategy on historical data and demo account, you can enhance your expertise in technical analysis and this will increase your chances of success in financial markets.

Conclusion
Mastering technical analysis head and shoulders pattern is an essential step toward becoming a profitable trader. You can predict the possible market reversal with the help of head and shoulder patterns which is one of the strongest technical analysis tools. By using the power of profitable trading strategies along with proper identification of head and shoulder pattern on price chart, you can enhance your trading profit by correctly predicting the reversals. Avoid from the common mistakes of pre-matures entry, trading without stop loss and increased position size. Use the right tools and resources to recognize and implement the pattern. Use online forums, online courses and other educational resources to fine-tune your trading skills. Invest some dedication in the trading skills and with experience and practice, you will become a master of technical analysis and capture profitable opportunities in the financial markets.